AIって結局何なのかよく分からないので、とりあえず100日間勉強してみた Day16
経緯についてはこちらをご参照ください。
■本日の進捗
●不確実性推定を理解する
■はじめに
これまでscikit-learnのライブラリを通して、
- k-最近傍法
- ロジスティック回帰
- 線形サポートベクターマシン
- ナイーブベイズクラス分類器
- 決定木
- ランダムフォレスト
- 勾配ブースティング回帰木
- カーネル法サポートベクターマシン
- 多層パーセプトロン(ニューラルネットワーク)
でのクラス分類を予測する機械学習モデルを作ってきました。
今回はそのクラス分類器の予測に対する不確実性を確かめていきたいと思います。
■クラス分類の不確実性推定
不確実性推定とは、機械学習モデルが自らの予測に対してどれだけ自信を持っているのかを推定する手法です。これまではR2スコアで作成したモデルの性能を確認してきましたが、テストデータに対するスコアが同程度であったとしても、その予測が80%正しいと思って出した答えなのか、50%くらいしか自信がないけどたまたま正解だったのかでは本当の意味での性能は違うと思います。
scikit-learnには標準で決定関数(decision_function)と確率予測(predict_proba)を実装しています。
まずは決定関数で不確実性を推定していきます。
■決定関数
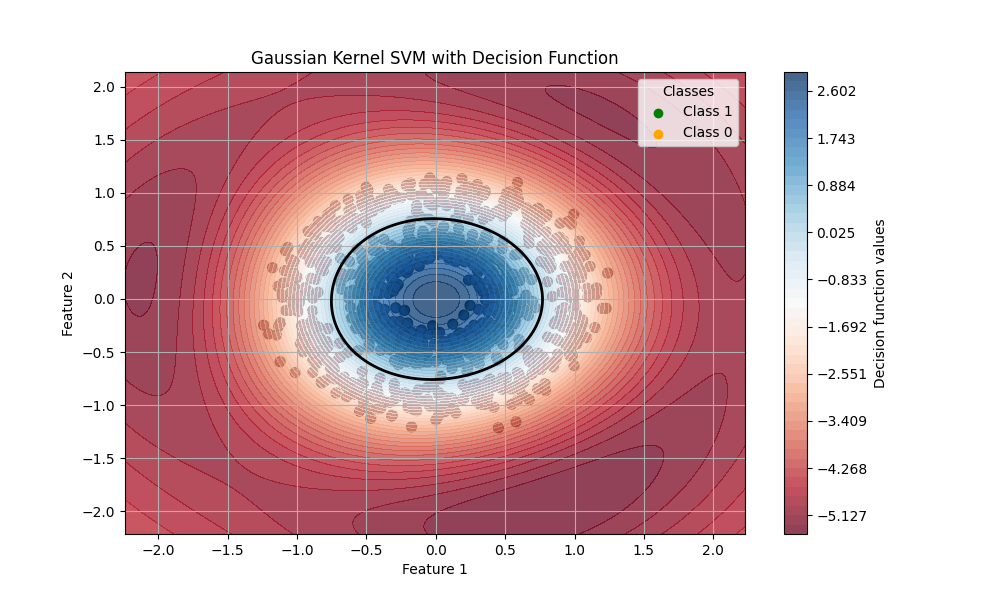
決定関数は各入力データがあるクラスに属する可能性を示すスコアや距離を返す関数で、(例えば)サポートベクターマシンで見た超平面(決定境界としての線や平面)からデータがどのくらい離れてるかを示し、0に近いほど決定境界に近く不確実性が高いということになります。
以前make_circlesデータセットで作成したカーネル法サポートベクターマシンモデルの不確実性を決定関数で見ていきます。
import numpy as np
import matplotlib.pyplot as plt
from sklearn.datasets import make_circles
from sklearn.model_selection import train_test_split
from sklearn.svm import SVC

X, y = make_circles(n_samples=1000, noise=0.1, factor=0.5, random_state=8)

X_train, X_test, y_train, y_test = train_test_split(X, y, test_size=0.3, random_state=8)

# model = SVC(kernel='rbf', C=1.0, gamma=0.5, decision_function_shape='ovr')
model = SVC(kernel='rbf', C=1.0, gamma=0.5)
model.fit(X_train, y_train)

print("train score: {}".format(model.score(X_train, y_train)))
print("test score: {}".format(model.score(X_test, y_test)))

x_min, x_max = X[:, 0].min() - 1, X[:, 0].max() + 1
y_min, y_max = X[:, 1].min() - 1, X[:, 1].max() + 1
xx, yy = np.meshgrid(np.arange(x_min, x_max, 0.01), np.arange(y_min, y_max, 0.01))

Z = model.decision_function(np.c_[xx.ravel(), yy.ravel()])
Z = Z.reshape(xx.shape)

plt.figure(figsize=(10, 6))

plt.scatter(X[:, 0], X[:, 1], c=y, cmap=plt.cm.colors.ListedColormap(['orange', 'green']), edgecolors='k', s=50)

plt.contourf(xx, yy, Z, levels=np.linspace(Z.min(), Z.max(), 50), cmap='RdBu', alpha=0.75)
plt.contour(xx, yy, Z, levels=[0], linewidths=2, colors='black')

plt.scatter([], [], c='green', label='Class 1')
plt.scatter([], [], c='orange', label='Class 0')
plt.legend(title='Classes')
plt.title('Gaussian Kernel SVM with Decision Function')
plt.xlabel('Feature 1')
plt.ylabel('Feature 2')
plt.grid(True)
plt.colorbar()
plt.show()
train score: 0.9928571428571429
test score: 0.9866666666666667
決定関数の値が正であれば(慣例的には)Class 1に、負の値であればClass 0と予測されます。この値が大きいほどこのモデルがその予測結果に自信を持っているということになり、2.0以上はほとんど確信に近く、0.1辺りになると確度はかなり低くなります。この図では0を実線で書いてあります。この線を境に(決定関数としての)分類が変わります。
■確率予測
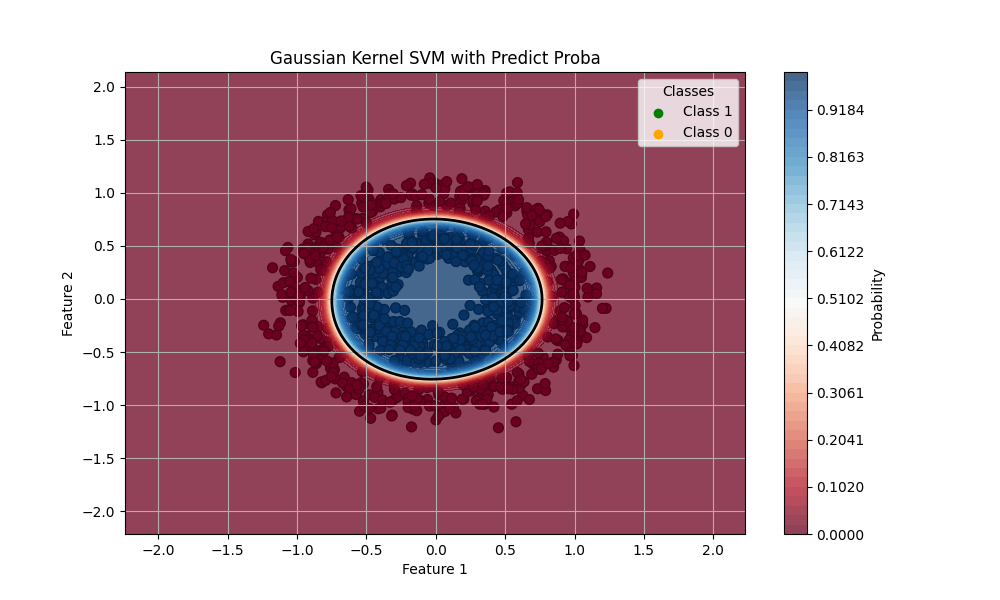
確率予測はその名の通り、クラスに分類される確率を返します。こちらは0から1の値を返すので、返り値が0.5に近いほど不確実性が高いということになります。
先ほどと同じモデルに対して推定をしてみます。
import numpy as np
import matplotlib.pyplot as plt
from sklearn.datasets import make_circles
from sklearn.model_selection import train_test_split
from sklearn.svm import SVC

X, y = make_circles(n_samples=1000, noise=0.1, factor=0.5, random_state=8)

X_train, X_test, y_train, y_test = train_test_split(X, y, test_size=0.3, random_state=8)

model = SVC(kernel='rbf', C=1.0, gamma=0.5, probability=True)
model.fit(X_train, y_train)

print("train score: {}".format(model.score(X_train, y_train)))
print("test score: {}".format(model.score(X_test, y_test)))

x_min, x_max = X[:, 0].min() - 1, X[:, 0].max() + 1
y_min, y_max = X[:, 1].min() - 1, X[:, 1].max() + 1
xx, yy = np.meshgrid(np.arange(x_min, x_max, 0.01), np.arange(y_min, y_max, 0.01))

proba = model.predict_proba(np.c_[xx.ravel(), yy.ravel()])
Z = proba[:, 1].reshape(xx.shape)

plt.figure(figsize=(10, 6))

plt.scatter(X[:, 0], X[:, 1], c=y, cmap='RdBu', edgecolors='k', s=50)

contour = plt.contourf(xx, yy, Z, levels=np.linspace(0, 1, 50), cmap='RdBu', alpha=0.75)
plt.contour(xx, yy, Z, levels=[0.5], linewidths=2, colors='black')

cbar = plt.colorbar(contour)
cbar.set_label('Probability')

plt.scatter([], [], c='green', label='Class 1')
plt.scatter([], [], c='orange', label='Class 0')
plt.legend(title='Classes')
plt.title('Gaussian Kernel SVM with Predict Proba')
plt.xlabel('Feature 1')
plt.ylabel('Feature 2')
plt.grid(True)
plt.show()
train score: 0.9928571428571429
test score: 0.9866666666666667
ちょうど境界(0.5の線が実線で示されています)の近くにどちらのクラスに分類されるかの確率が低い範囲が確認できます。
決定境界の方が同じクラスに分類される(であろう)領域の中でもどのくらいの確度の差異があるのかが分かりやすかったです。確率予測の方は標準ではコンターレンジが狭くなってしまうのではっきりしているように見えます。分類というタスクに関しては場合によってはこちらの方が分かりやすいでしょうか。(これは決定関数の返り値を正規化すれば同じことが言えます。)
■多クラス分類での不確実性推定
もちろんこれまで見てきた決定関数と確率予測は多クラス分類モデルにも適用できます。
●多クラス分類における決定関数
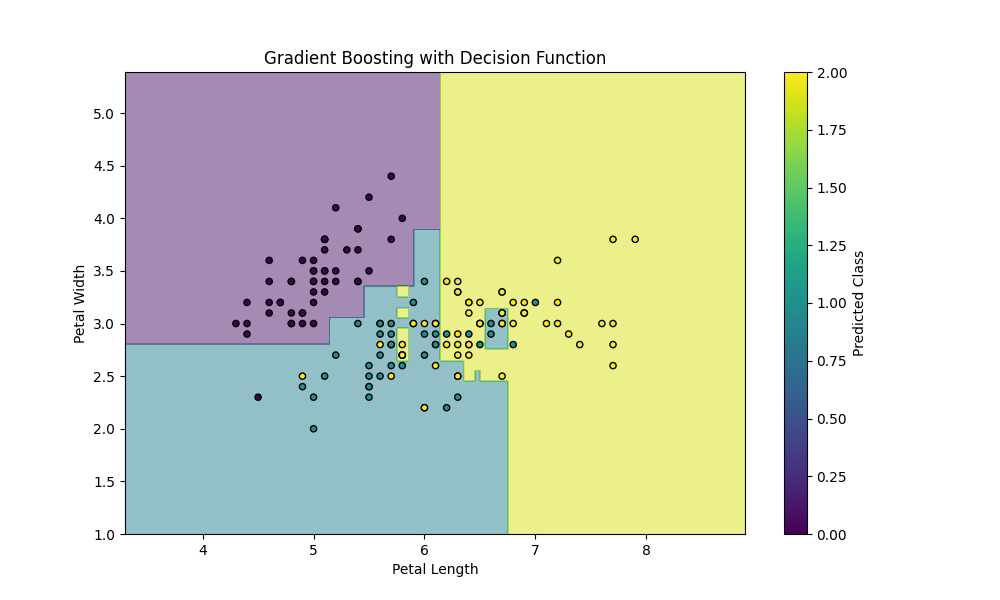
勾配ブースティング回帰木の記事で作成したあやめデータセットに対する多クラス分類予測モデルを決定関数で不確実性推定していきます。
import numpy as np
import pandas as pd
import matplotlib.pyplot as plt
from sklearn.datasets import load_iris
from sklearn.model_selection import train_test_split
from sklearn.ensemble import GradientBoostingClassifier

iris = load_iris()
X = iris.data[:, :2]
y = iris.target

X_train, X_test, y_train, y_test = train_test_split(X, y, test_size=0.3, random_state=8)

n = 100
model = GradientBoostingClassifier(n_estimators=n, learning_rate=0.1, max_depth=2, random_state=8)
model.fit(X_train, y_train)

x_min, x_max = X[:, 0].min() - 1, X[:, 0].max() + 1
y_min, y_max = X[:, 1].min() - 1, X[:, 1].max() + 1
xx, yy = np.meshgrid(np.arange(x_min, x_max, 0.01),
                     np.arange(y_min, y_max, 0.01))

Z = model.predict(np.c_[xx.ravel(), yy.ravel()])
Z = Z.reshape(xx.shape)

plt.figure(figsize=(10, 6))
plt.contourf(xx, yy, Z, alpha=0.5, cmap='viridis')
plt.scatter(X[:, 0], X[:, 1], c=y, edgecolor='k', s=20, cmap='viridis')
plt.xlabel('Petal Length')
plt.ylabel('Petal Width')
plt.title('Gradient Boosting with Decision Function')
plt.colorbar(label='Predicted Class')
plt.show()

可視化のために2特徴量のみにして、パラメーターを少し弄っています。(シンプルなモデルにすると、決定境界も決定関数の値もかなりシンプルになってしまい見てて得るものが少ないので…。)データポイントの中に2つのクラスが混ざり合う領域があるので、より興味深いです。
●多クラス分類における確率予測
import numpy as np
import pandas as pd
import matplotlib.pyplot as plt
from sklearn.datasets import load_iris
from sklearn.model_selection import train_test_split
from sklearn.ensemble import GradientBoostingClassifier

iris = load_iris()
X = iris.data[:, :2]
y = iris.target

X_train, X_test, y_train, y_test = train_test_split(X, y, test_size=0.3, random_state=8)

n = 100
model = GradientBoostingClassifier(n_estimators=n, learning_rate=0.1, max_depth=2, random_state=8)
model.fit(X_train, y_train)

x_min, x_max = X[:, 0].min() - 1, X[:, 0].max() + 1
y_min, y_max = X[:, 1].min() - 1, X[:, 1].max() + 1
xx, yy = np.meshgrid(np.arange(x_min, x_max, 0.01),
                     np.arange(y_min, y_max, 0.01))

Z_prob = model.predict_proba(np.c_[xx.ravel(), yy.ravel()])
Z_max = np.argmax(Z_prob, axis=1).reshape(xx.shape)

plt.figure(figsize=(10, 6))
plt.contourf(xx, yy, Z_max, alpha=0.5, cmap='viridis')
plt.scatter(X[:, 0], X[:, 1], c=y, edgecolor='k', s=20, cmap='viridis')
plt.xlabel('Petal Length')
plt.ylabel('Petal Width')
plt.title('Gradient Boosting with Predict Proba')
plt.colorbar(label='Predicted Class')
plt.show()

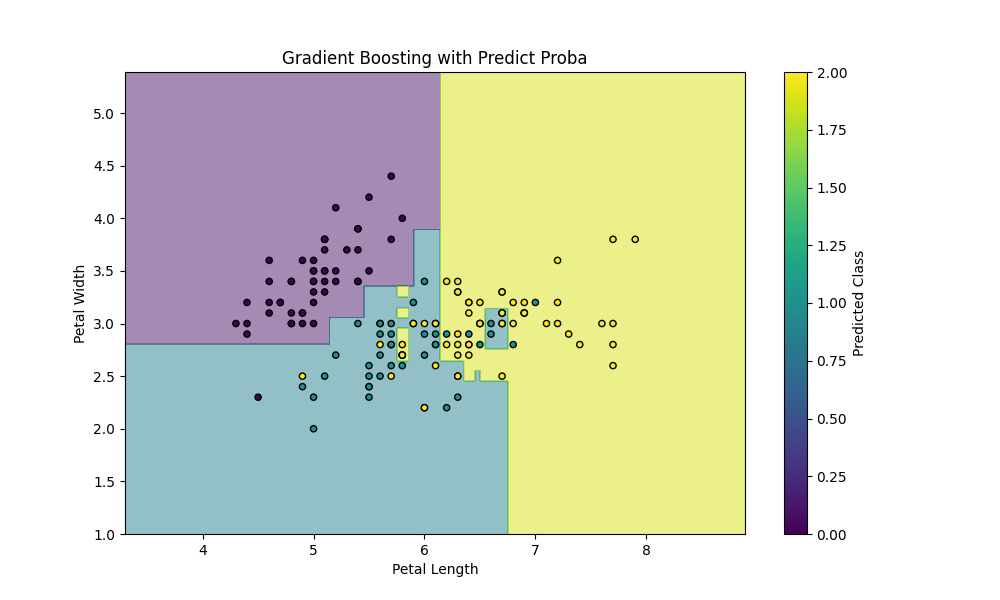
確率予測でもargmaxで最大確率のクラスを取得すれば、クラスラベル(0, 1, 2)に変換することが可能です。
■おわりに
今回はこれまでに作成してきたモデルに対して不確実性推定を行ってみました。2クラス分類では直観通りの不確実性を持っていることを確認(あくまで例として)できましたが、多クラス分類においては誤分類が起こるであろう座標が可視化できています。これはモデルの精度を高める(複雑さの制御やスコアなど)ことに関して、またモデルの挙動理解に関して良い指標になると思います。
■参考文献
- Andreas C. Muller, Sarah Guido. Pythonではじめる機械学習. 中田 秀基 訳. オライリー・ジャパン. 2017. 392p.
- ChatGPT. 4o mini. OpenAI. 2024. https://chatgpt.com/
- API Reference. scikit-learn.org. https://scikit-learn.org/stable/api/index.html