AIって結局何なのかよく分からないので、とりあえず100日間勉強してみた Day17
経緯についてはこちらをご参照ください。
■本日の進捗
●PCAを理解
■はじめに
引き続き「Pythonではじめる機械学習(オライリー・ジャパン)」で学んでいきます。
これまで作ってきた機械学習モデルは「教師あり学習」と呼ばれるアルゴリズムで構成されていました。教師ありとはラベルや正解の情報をこちらから与えてそれを基に学んでいきますが、「教師なし学習」にはこれらの情報がありません。
どちらかというと教師なし学習の方が生物っぽいのかもしれません。例えば幼い子供でもりんごとみかんの区別はつきます。あの明るい色の物が「りんご」で、それとは違う明るい色の物が「みかん」だと。その名前は親から学びますが、それより先に区別自体はついているはずです。また、違う品種(重要なのは初めて見る品種だということ)のりんごを見せても、彼ら彼女らはりんごに分類するでしょう。生き物というのは素晴らしい教師なし学習モデルです。このように正解のないデータからアルゴリズムが自ら(!!!)違いを学習(色?形?大きさ?何に違いを見出すのかも自ら学びます)していくことができます。
ここで大きな問題は、モデルの評価をするのが難しい(これまではR2スコアでテストデータを予測させて正答を評価していましたが、これができません)のと、モデルが何を学習するのかわからないことです。
■PCA
主成分分析(principal component analysis : PCA)とは、データセットの情報をなるべく保持しながら次元削減を行う手法です。
データセットからデータセットの平均を引いて原点中心に移動した後、データ分散と異なるの次元間の共分散を表す共分散行列を計算します。この共分散行列から固有値と固有ベクトルを計算し、分散が大きな方向(主成分)を見つけ、最も重要な次元を選びます。最後にデータを主成分に新たな低次元空間として投影して次元を削減します。
scikit-learnでもPCAクラスを実装しているので、主成分の抽出や次元削減が可能です。
あやめデータセット(4特徴量)に対してPCAを実施して2次元に次元削減してみたいと思います。
from sklearn.datasets import load_iris
from sklearn.preprocessing import StandardScaler
from sklearn.decomposition import PCA
import matplotlib.pyplot as plt
import numpy as np

iris = load_iris()
data = iris.data
target = iris.target
feature_names = iris.feature_names

scaler = StandardScaler()
data_scaled = scaler.fit_transform(data)

pca = PCA(n_components=2)
principal_components = pca.fit_transform(data_scaled)

pca_1_component = pca.components_[0]
reversed_component = np.outer(principal_components[:, 0], pca_1_component)

fig, axs = plt.subplots(2, 2, figsize=(12, 12))

axs[0, 0].scatter(data[:, 0], data[:, 1], c=target, cmap='viridis', edgecolor='k')
axs[0, 0].set_xlabel(feature_names[0])  # Sepal Length
axs[0, 0].set_ylabel(feature_names[1])  # Sepal Width
axs[0, 0].set_title('Before PCA (Original Data)')

axs[0, 1].scatter(principal_components[:, 0], principal_components[:, 1], c=target, cmap='viridis', edgecolor='k')
axs[0, 1].set_xlabel('Principal Component 1')
axs[0, 1].set_ylabel('Principal Component 2')
axs[0, 1].set_title('After PCA (2 Components)')

axs[1, 0].scatter(principal_components[:, 0], [0] * len(principal_components), c=target, cmap='viridis', edgecolor='k')
axs[1, 0].set_xlabel('Principal Component 1')
axs[1, 0].set_ylabel('Dropped Component 2')
axs[1, 0].set_title('After PCA (Only 1st Component)')

axs[1, 1].scatter(reversed_component[:, 0], reversed_component[:, 1], c=target, cmap='viridis', edgecolor='k')
axs[1, 1].set_xlabel(feature_names[0])  # Sepal Length
axs[1, 1].set_ylabel(feature_names[1])  # Sepal Width
axs[1, 1].set_title('After PCA (Reversed 1st Component, Reprojected)')

plt.tight_layout()
plt.show()
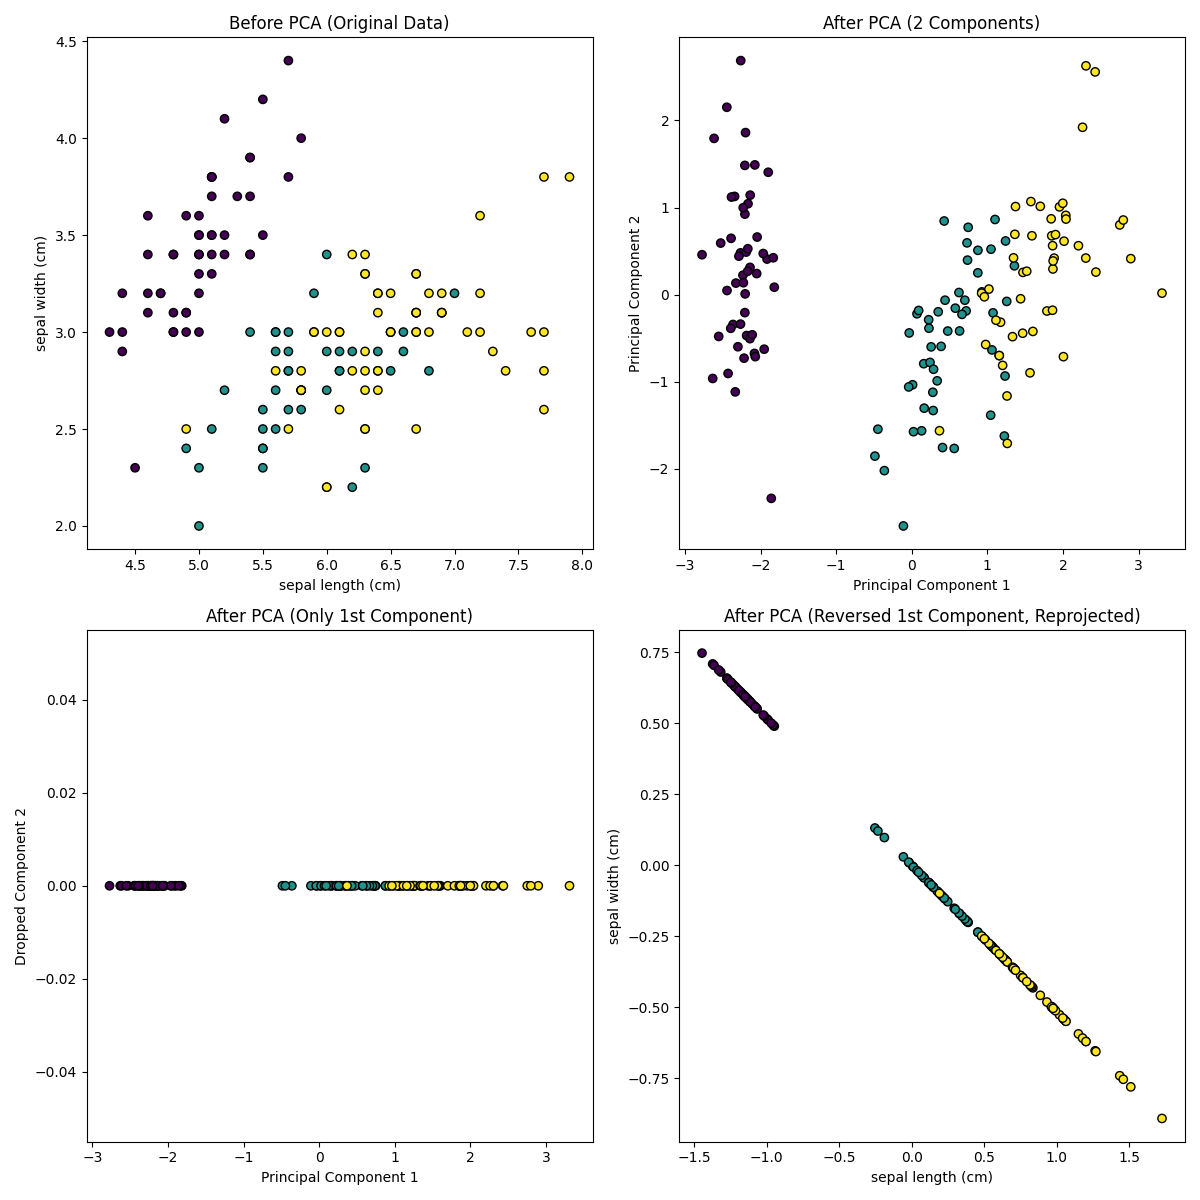
データセットを標準化しPCAを実施してみました。可視化のために2特徴量を選んで元データをプロットしています(ここではsepal lengthとsepal width)。しかし、PCA実施後のプロットは第1成分と第2成分によるプロットに変更されています。この主成分はPCAの結果として得られるものであり、データの分散を最も説明できる新しい軸です。
第2成分を落とすと第1成分のみの1次元データに変換でき(左下図)、逆回転して元データの方向に戻すと元データから次元が落ちていることが分かります。
PCAはもちろん高次元データセットに対しても適用できます。
あやめデータセットより次元の高い(13特徴量ですが)ワインデータセットに適用してみたいと思います。
まずは、このデータセットのクラスごとの特徴量頻度でヒストグラムを見てみます。
import numpy as np
import pandas as pd
import matplotlib.pyplot as plt
from sklearn.datasets import load_wine

wine = load_wine()
X = wine.data
y = wine.target
feature_names = wine.feature_names

n_features = X.shape[1]
fig, axs = plt.subplots(n_features, 1, figsize=(10, 30 * n_features))

for i in range(n_features):
    axs[i].hist(X[y == 0, i], bins=20, alpha=0.5, label='Class 0', color='r')
    axs[i].hist(X[y == 1, i], bins=20, alpha=0.5, label='Class 1', color='g')
    axs[i].hist(X[y == 2, i], bins=20, alpha=0.5, label='Class 2', color='b')
    axs[i].set_title(f'Histogram of {feature_names[i]}')
    axs[i].set_xlabel(feature_names[i])
    axs[i].set_ylabel('Frequency')
    axs[i].legend()

plt.tight_layout()
plt.show()
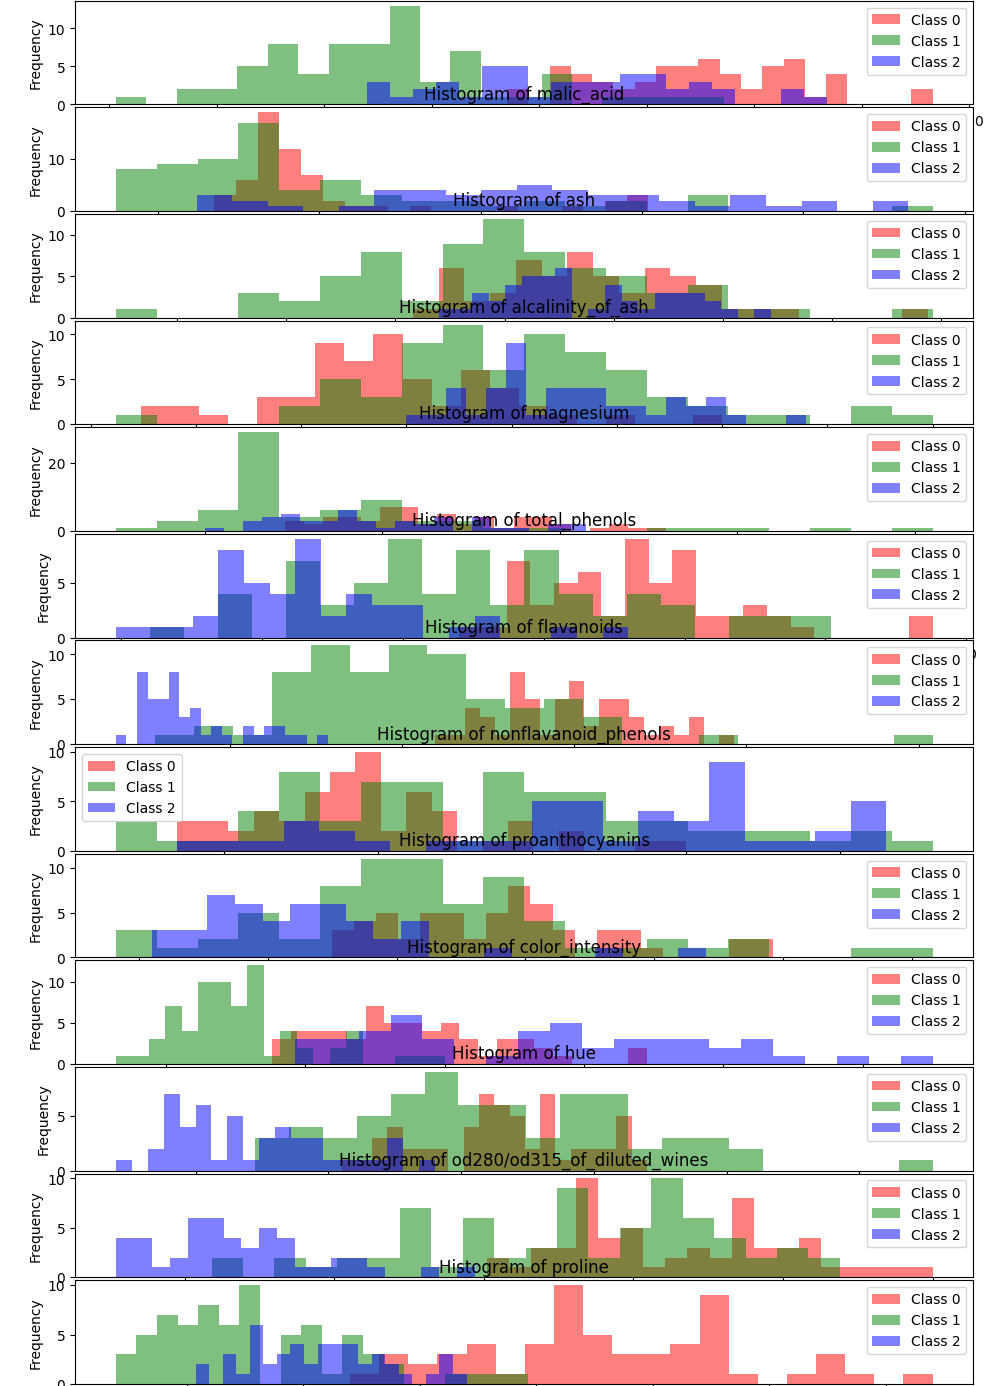
ここで注目すべきは、(本来は違うがPCAをする目的として)上から3,4,9個目辺りでしょうか。クラスが重なり合っていて、分類に関して多くの情報があるようには思えません。しかし、これらの特徴量が互いに相関があるのか、そしてその相関関係がクラス分類に強く影響を与えるのかは何も分かりません。
PCAを用いればこれらの相関を保持したまま次元を落とすことが可能です。
import numpy as np
import pandas as pd
import matplotlib.pyplot as plt
from sklearn.datasets import load_wine
from sklearn.decomposition import PCA
from sklearn.preprocessing import StandardScaler

wine = load_wine()
X = wine.data
y = wine.target
feature_names = wine.feature_names

scaler = StandardScaler()
X_scaled = scaler.fit_transform(X)

pca = PCA(n_components=2)
X_pca = pca.fit_transform(X_scaled)

plt.figure(figsize=(10, 7))
scatter = plt.scatter(X_pca[:, 0], X_pca[:, 1], c=y, cmap='viridis', edgecolor='k', s=100)
plt.title('PCA of Wine Dataset')
plt.xlabel('Principal Component 1')
plt.ylabel('Principal Component 2')

plt.legend(*scatter.legend_elements(), title='Classes')

plt.grid()
plt.show()
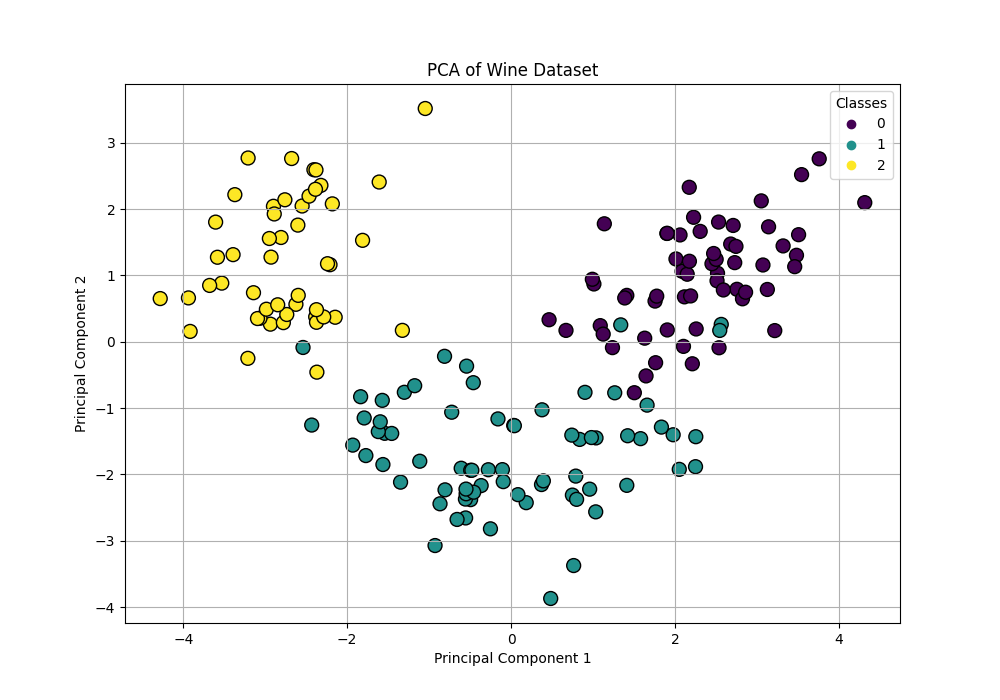
第1成分と第2成分でプロットしてみましたが、かなり綺麗に分離できています。ここで注目していただきたいのが、PCAを実施するにあたって教師データ(クラスの値、ラベル)を与えていないことです。それでも目視でここまで綺麗に分類できそうなプロットになっていることは驚くべきことで、重要な情報のみで上手く抽出できていることが分かります。
ただこのままでは結局どの特徴量が使われたのかが分からないままです。PCAではcomponents_属性という情報を生成していて、この係数を見ることで各特徴量ごとに各主成分の係数を見ることができます。
import numpy as np
import pandas as pd
import matplotlib.pyplot as plt
from sklearn.datasets import load_wine
from sklearn.decomposition import PCA
from sklearn.preprocessing import StandardScaler

wine = load_wine()
X = wine.data
feature_names = wine.feature_names

scaler = StandardScaler()
X_scaled = scaler.fit_transform(X)

pca = PCA(n_components=2)
pca.fit(X_scaled)

components = pca.components_
fig, ax = plt.subplots(figsize=(8, 6))

cax = ax.matshow(components[:2, :], cmap='coolwarm')
plt.colorbar(cax)

ax.set_xticks(np.arange(len(feature_names)))
ax.set_xticklabels(feature_names, rotation=45, ha='right')
ax.set_yticks(np.arange(2))
ax.set_yticklabels([f'PC{i+1}' for i in range(2)])

plt.title('PCA Components Heatmap', pad=20)
plt.xlabel('Features')
plt.ylabel('Principal Components')
plt.tight_layout()
plt.show()
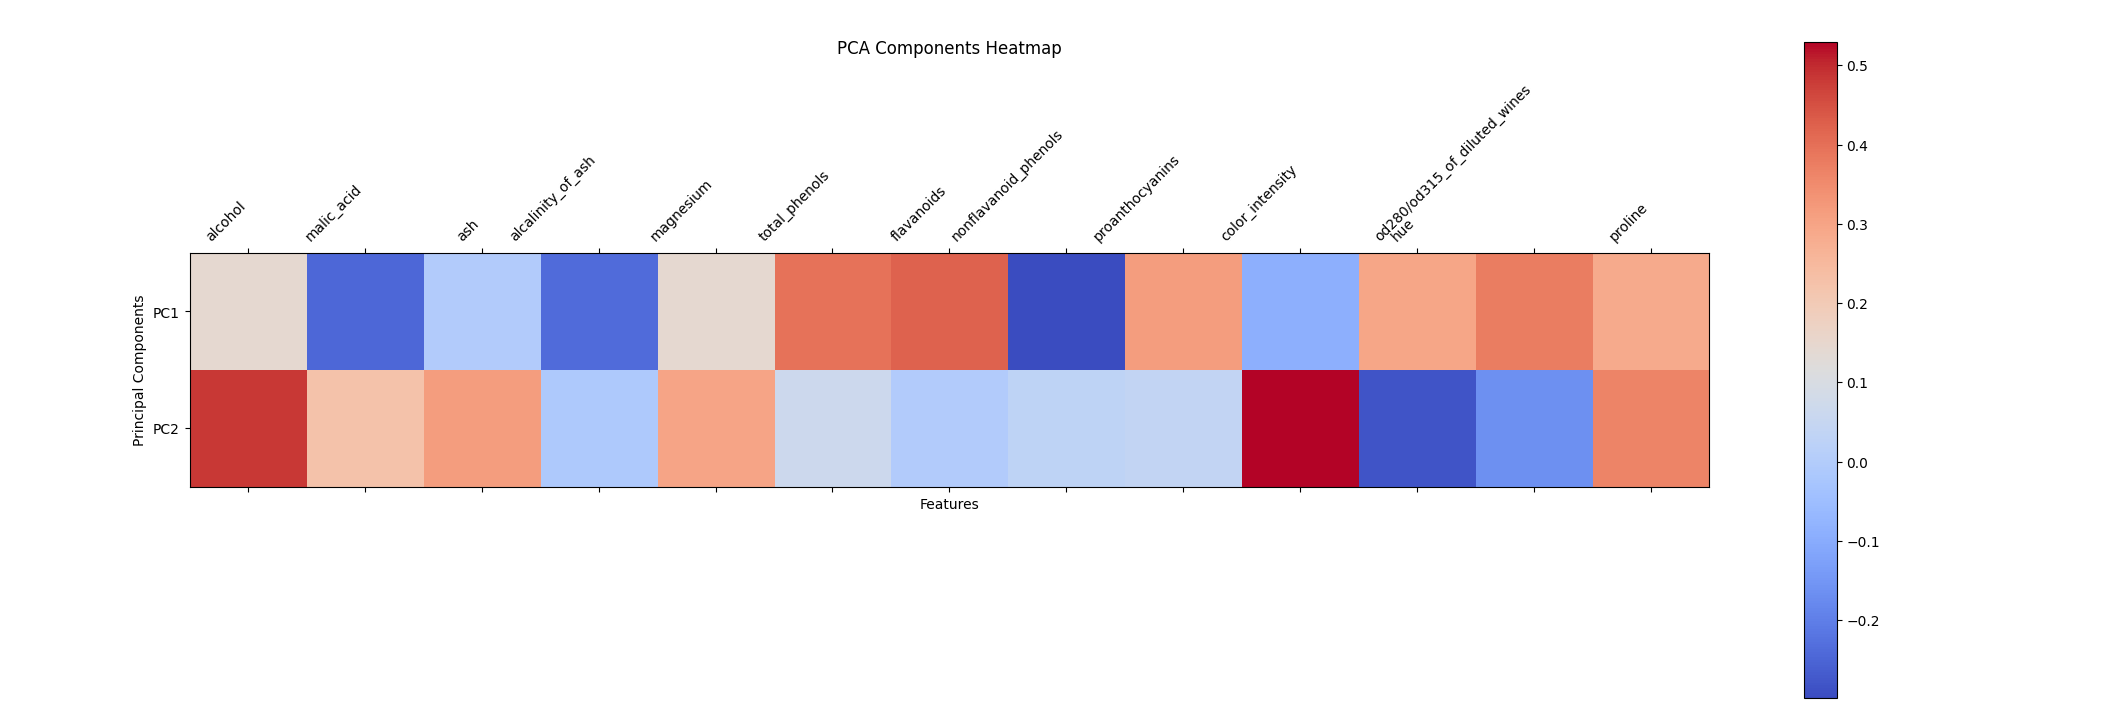
component_属性の係数をヒートマップに表してみました。正の値が正の相関で、負の値が負の相関があることを示しています。
■画像認識
複雑なデータから特徴量を抽出するPCAに適したアプリケーションとして画像認識があります。scikit-learnには標準でLabeled Faces in the Wildデータセットというのがあり、これには主にアメリカの有名人の方々の写真が62人3023枚保存されています。(これ肖像権大丈夫なのか?)
軽量化のためひとり辺り最大50枚に制限して、データをそのままk-NNモデルに適用してみました。
import numpy as np
from sklearn.datasets import fetch_lfw_people
from sklearn.model_selection import train_test_split
from sklearn.neighbors import KNeighborsClassifier
from sklearn.metrics import classification_report

lfw_people = fetch_lfw_people(min_faces_per_person=20, resize=0.7)

X = lfw_people.data
y = lfw_people.target

n_samples, h, w = lfw_people.images.shape
unique, counts = np.unique(y, return_counts=True)
max_images_per_person = 50
limited_indices = []
for i in range(len(unique)):
    indices = np.where(y == unique[i])[0]
    limited_indices.extend(indices[:max_images_per_person])
limited_indices = np.array(limited_indices)

X_people = X[limited_indices]
y_people = y[limited_indices]

X_scaled = X_people / 255.0

X_train, X_test, y_train, y_test = train_test_split(X_scaled, y_people, test_size=0.2, random_state=8)

knn = KNeighborsClassifier(n_neighbors=1)
knn.fit(X_train, y_train)

accuracy = knn.score(X_test, y_test)

print("Test Accuracy: {:.2f}%".format(accuracy * 100))
Test Accuracy: 19.37%顔写真に対して学習(ここではk-NNを用いているので教師あり学習であることに注意)させたにしてはそこそこの精度でしょうか。
続いてPCAを挟んでから同様にk-NNで学習してみます。
import numpy as np
from sklearn.datasets import fetch_lfw_people
from sklearn.model_selection import train_test_split
from sklearn.decomposition import PCA
from sklearn.neighbors import KNeighborsClassifier
from sklearn.metrics import classification_report

lfw_people = fetch_lfw_people(min_faces_per_person=20, resize=0.7)

X = lfw_people.data
y = lfw_people.target

n_samples, h, w = lfw_people.images.shape
unique, counts = np.unique(y, return_counts=True)
max_images_per_person = 50
limited_indices = []
for i in range(len(unique)):
    indices = np.where(y == unique[i])[0]
    limited_indices.extend(indices[:max_images_per_person])
limited_indices = np.array(limited_indices)

X_people = X[limited_indices]
y_people = y[limited_indices]

X_scaled = X_people / 255.0

X_train, X_test, y_train, y_test = train_test_split(X_scaled, y_people, test_size=0.2, random_state=8)

n_components = 100
pca = PCA(n_components=n_components, whiten=True, random_state=8)
X_train_pca = pca.fit_transform(X_train)
X_test_pca = pca.transform(X_test)

knn = KNeighborsClassifier(n_neighbors=1)
knn.fit(X_train_pca, y_train)

accuracy = knn.score(X_test_pca, y_test)

print("Test Accuracy: {:.2f}%".format(accuracy * 100))
Test Accuracy: 30.27%グッと分類精度が上がりました。皆さんはアメリカの有名人の方の写真を見て3回に1回は正確に分類できますか?自分はレーシングドライバーでもなければ(10数年間余暇のほとんどの時間をかけて蓄積された膨大なデータ量で学習したモデルです)見分ける自信はそんなにないです。既に一定数の人間よりは優秀な分類器が数秒で構築できたと言えるのではないでしょうか。
ちなみにPCAクラスの引数であるwhitenは、主成分の出力を標準化するかどうかを切り替えるためのパラメータで、デフォルトのFalseでは元データの分散を反映したスケールで主成分を構築しますが、Trueにすると各主成分の分散が1になるよう標準化されます。特定のデータが強く影響を与えることを抑制し、影響を平準化することができます。
最後にPCAの主成分の数を10から500まで10ずつ増やしていった時の挙動を確認してみましょう。
import numpy as np
import matplotlib.pyplot as plt
from sklearn.datasets import fetch_lfw_people
from sklearn.model_selection import train_test_split
from sklearn.decomposition import PCA
from sklearn.neighbors import KNeighborsClassifier

lfw_people = fetch_lfw_people(min_faces_per_person=20, resize=0.7)

X = lfw_people.data
y = lfw_people.target

n_samples, h, w = lfw_people.images.shape
unique, counts = np.unique(y, return_counts=True)
max_images_per_person = 50
limited_indices = []
for i in range(len(unique)):
    indices = np.where(y == unique[i])[0]
    limited_indices.extend(indices[:max_images_per_person])
limited_indices = np.array(limited_indices)

X_people = X[limited_indices]
y_people = y[limited_indices]

X_scaled = X_people / 255.0

X_train, X_test, y_train, y_test = train_test_split(X_scaled, y_people, test_size=0.2, random_state=8)

knn = KNeighborsClassifier(n_neighbors=1)

components_range = range(10, 501, 10)
scores = []

for n_components in components_range:
    pca = PCA(n_components=n_components, whiten=True, random_state=8)
    X_train_pca = pca.fit_transform(X_train)
    X_test_pca = pca.transform(X_test)

    knn.fit(X_train_pca, y_train)
    score = knn.score(X_test_pca, y_test)
    scores.append(score)

plt.figure(figsize=(10, 6))
plt.plot(components_range, scores, marker='o')
plt.title('k-NN Classifier Accuracy : PCA Components')
plt.xlabel('Number of PCA Components')
plt.ylabel('Test Accuracy')
plt.grid(True)
plt.show()
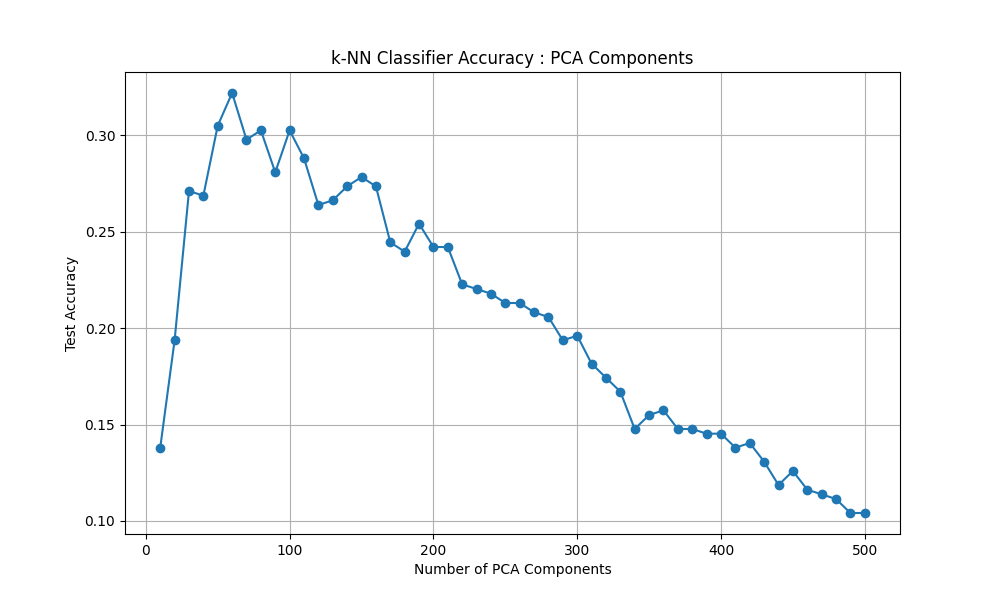
主成分が少ない場合は、情報が欠損(PCAを挟む前より精度が落ちていることに注目)している可能性がありほとんど学習できていません。また、主成分が多すぎても次元の呪いや過剰適合、ノイズを拾うなどの理由で精度が大きく落ちていきます。
今回の場合は、60程度の主成分が最も良いということが分かりました。
■おわりに
今日はPCAを導入してその効果をk-NNによるクラス分類問題を通して経験していきました。
PCAが前処理として優秀なことは分かりましたが、結局教師あり学習じゃないか!と思うかもしれません。もちろんPCAは教師あり学習においてもその実力を十分に発揮してくれますが、重要なのはこのような次元削減がラベルを必要としていないことにあります。
本記事の前半で見たように、クラス分類を一切教えていないにも関わらず、特徴量(ここではワインの成分とその量)の情報のみで3種類のワインを(正確にはしていないがほとんど目的は果たしているという意味で)分類してみせました。これは立派な教師なし学習の一部と言えるのではないでしょうか。
子どもが後にその名前を教わるりんごとみかんを事前に区別しているのと同様に。
■参考文献
- Andreas C. Muller, Sarah Guido. Pythonではじめる機械学習. 中田 秀基 訳. オライリー・ジャパン. 2017. 392p.
- ChatGPT. 4o mini. OpenAI. 2024. https://chatgpt.com/
- API Reference. scikit-learn.org. https://scikit-learn.org/stable/api/index.html
- 主成分分析(PCA). ibm.com. https://www.ibm.com/docs/ja/db2oc?topic=procedures-principal-component-analysis-pca