AIって結局何なのかよく分からないので、とりあえず100日間勉強してみた Day12
経緯についてはこちらをご参照ください。
前回の内容は下記をご参照ください。
■本日の進捗
●線形モデルを使ってみる
■はじめに
今回は前回勉強した回帰問題に適用した線形モデルの概念をクラス分類問題にも適用していきたいと思います。
■ロジスティック回帰
線形モデルはクラス分類にも使えます。
概念はとても簡単で、前回も示した式が0より大きいかどうかでクラスを分類できます。
$$ \hat{y} = w[0] \times x[0] + w[1] \times x[1] + \cdots + w[[p] \times x[p] + b \ > \ 0 $$
ロジスティック回帰はバイナリ分類(二値分類)に適用され、入力値zを0から1の間の確率に変換するシグモイド関数を用いてデータが特定のクラスに属する確率を予測するモデルです。
$$ \hat{p} = \sigma (\boldsymbol{w}^T x + b) $$
$$ \sigma (z) = \frac{1}{1 + e^{-z}} $$
損失関数は交差エントロピーを用いて、予測確率からの誤差を測定します。
$$ F_{loss} = -\frac{1}{N} \displaystyle \sum_{i=1}^N [\ y_i \log(\hat{p_i}) + (1 \ – \ y_i)\log(1 \ – \ \hat{p_i})\ ] $$
それではロジスティック回帰を用いてあやめデータセットでクラス分類モデルを作っていきたいと思います。
import numpy as np
import matplotlib.pyplot as plt
from sklearn import datasets
from sklearn.linear_model import LogisticRegression
from sklearn.preprocessing import StandardScaler
from sklearn.model_selection import train_test_split
from matplotlib.colors import ListedColormap

iris = datasets.load_iris()
X = iris.data[:, :2]
y = iris.target

X_train, X_test, y_train, y_test = train_test_split(X, y, test_size=0.3, random_state=8)

scaler = StandardScaler()
X_train_scaled = scaler.fit_transform(X_train)
X_test_scaled = scaler.transform(X_test)

model = LogisticRegression()
model.fit(X_train_scaled, y_train)

print("train score :{}".format(model.score(X_train_scaled, y_train)))
print("test score :{}".format(model.score(X_test_scaled, y_test)))

x_min, x_max = X_train_scaled[:, 0].min() - 0.5, X_train_scaled[:, 0].max() + 0.5
y_min, y_max = X_train_scaled[:, 1].min() - 0.5, X_train_scaled[:, 1].max() + 0.5
xx, yy = np.meshgrid(np.arange(x_min, x_max, 0.02),
                     np.arange(y_min, y_max, 0.02))

Z = model.predict(np.c_[xx.ravel(), yy.ravel()])
Z = Z.reshape(xx.shape)

custom_cmap = ListedColormap(['lightcoral', 'lightgreen', 'lightblue'])

plt.contourf(xx, yy, Z, alpha=0.6, cmap=custom_cmap)

for i, color in zip([0, 1, 2], ['red', 'green', 'blue']):
    idx = np.where(y_train == i)
    plt.scatter(X_train_scaled[idx, 0], X_train_scaled[idx, 1], c=color, label=iris.target_names[i], edgecolor='k', s=50)

plt.xlabel('Sepal length (standardized)')
plt.ylabel('Sepal width (standardized)')
plt.title('Logistic Regression - Iris Dataset (Actual Classes)')
plt.legend()
plt.show()
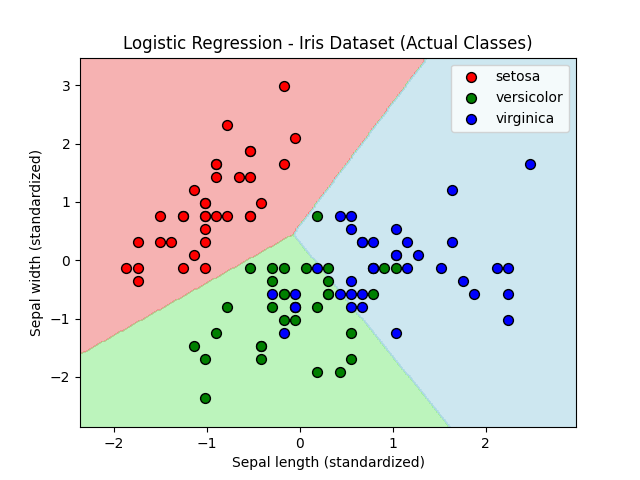
train score :0.8571428571428571
test score :0.6666666666666666
あやめデータセットから2つの特徴量のみを用いてモデルを作成してみました。スコアはトレーニングデータでの結果がよく、テストデータでの結果はいまいちでした。特徴量を半分にした結果、この組み合わせでは過剰適合になってしまったのでしょうか。
■1対その他アプローチ(one-vs. -rest)
ロジスティック回帰は線形モデルの中では特殊で、多クラス分類にも適用可能です。しかしほとんどの線形モデルは2クラス分類にしか対応しておらず、多クラス分類を行うには1対その他アプローチが必要になります。
1対その他アプローチとは、その名の通り常にあるクラスに対してそのクラスかそれ以外かで分類していきます。すべての組み合わせに対して2クラス分類を学習したモデルが入力値に対して最も確率の高いクラスを返してくれることで、その入力値がどのクラスに属するのかがわかります。
全く同じあやめデータセットをロジスティック回帰に1対その他アプローチで学習させてみます。
import numpy as np
import matplotlib.pyplot as plt
from sklearn import datasets
from sklearn.linear_model import LogisticRegression
from sklearn.preprocessing import StandardScaler
from sklearn.model_selection import train_test_split
from itertools import combinations
from matplotlib.colors import ListedColormap

iris = datasets.load_iris()
X = iris.data
y = iris.target
feature_names = iris.feature_names

X_train, X_test, y_train, y_test = train_test_split(X, y, test_size=0.3, random_state=8)

scaler = StandardScaler()
X_train_scaled = scaler.fit_transform(X_train)
X_test_scaled = scaler.transform(X_test)

feature_indices = list(combinations(range(4), 2))

fig, axes = plt.subplots(3, 2, figsize=(12, 18))
axes = axes.ravel()

custom_cmap = ListedColormap(['lightcoral', 'lightgreen', 'lightblue'])

train_scores = []
test_scores = []

for idx, (i, j) in enumerate(feature_indices):
    X_train_pair = X_train_scaled[:, [i, j]]
    X_test_pair = X_test_scaled[:, [i, j]]

    model = LogisticRegression(multi_class='ovr', solver='lbfgs')
    model.fit(X_train_pair, y_train)

    train_score = model.score(X_train_pair, y_train)
    test_score = model.score(X_test_pair, y_test)
    train_scores.append(train_score)
    test_scores.append(test_score)

    x_min, x_max = X_train_pair[:, 0].min() - 0.5, X_train_pair[:, 0].max() + 0.5
    y_min, y_max = X_train_pair[:, 1].min() - 0.5, X_train_pair[:, 1].max() + 0.5
    xx, yy = np.meshgrid(np.arange(x_min, x_max, 0.02),
                         np.arange(y_min, y_max, 0.02))

    Z = model.predict(np.c_[xx.ravel(), yy.ravel()])
    Z = Z.reshape(xx.shape)

    axes[idx].contourf(xx, yy, Z, alpha=0.6, cmap=custom_cmap)

    for k, color in zip([0, 1, 2], ['red', 'green', 'blue']):
        idx_k = np.where(y_train == k)
        axes[idx].scatter(X_train_pair[idx_k, 0], X_train_pair[idx_k, 1], c=color, label=iris.target_names[k], edgecolor='k', s=50)

    axes[idx].set_xlabel(feature_names[i])
    axes[idx].set_ylabel(feature_names[j])
    axes[idx].set_title(f'{feature_names[i]} vs {feature_names[j]}')

plt.tight_layout()
plt.show()
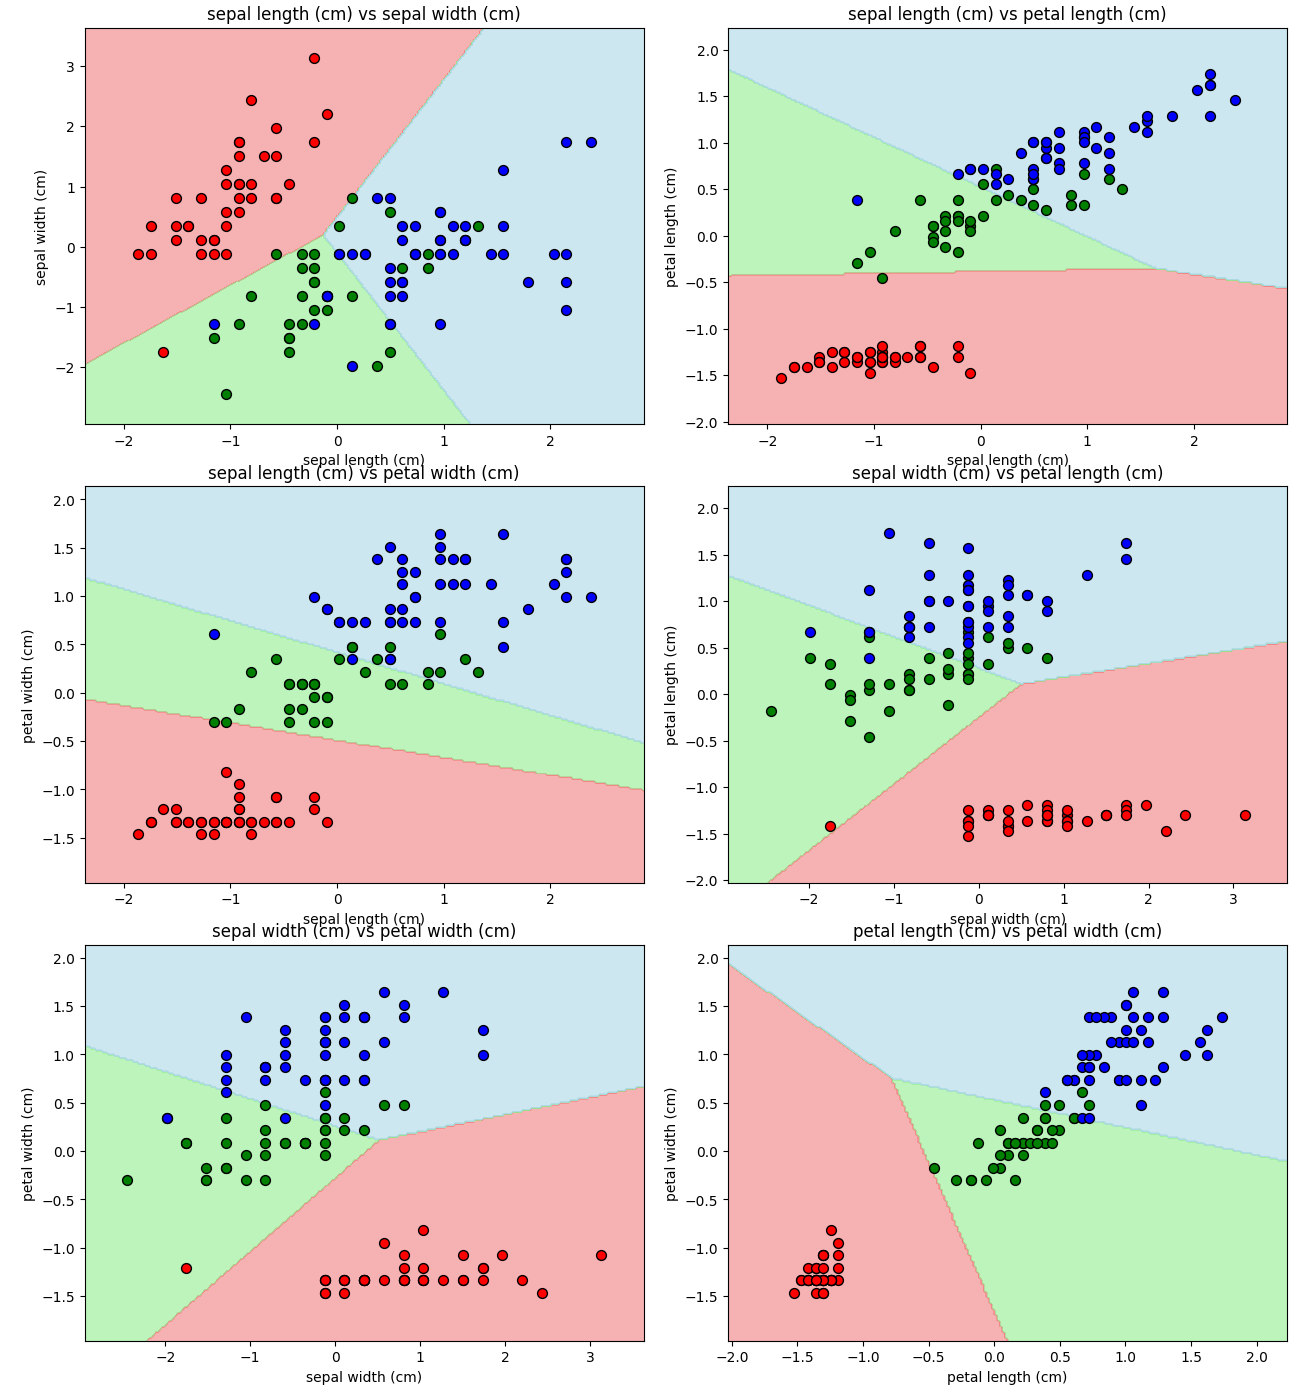
すべての特徴量の組み合わせに対して、うまく分類出来ているように見えます。
ちなみにこの時の各モデルのスコアは下記の通りでした。
Features: sepal length (cm) and sepal width (cm)
Training Score: 0.867, Test Score: 0.667

Features: sepal length (cm) and petal length (cm)
Training Score: 0.829, Test Score: 0.822

Features: sepal length (cm) and petal width (cm)
Training Score: 0.943, Test Score: 0.800

Features: sepal width (cm) and petal length (cm)
Training Score: 0.876, Test Score: 0.778

Features: sepal width (cm) and petal width (cm)
Training Score: 0.914, Test Score: 0.800

Features: petal length (cm) and petal width (cm)
Training Score: 0.971, Test Score: 0.911
テストスコアがトレーニングスコアを超えることはありませんでしたが、ほとんどの組み合わせで良いスコアを出していました。それなりに機能するモデルが作れたのかもしれません。
ただ、依然としてSepal lengthとSepal widthのかけ合わせではテストスコアの伸びがありませんでした。過剰適合が問題ではなかったのでしょうか。
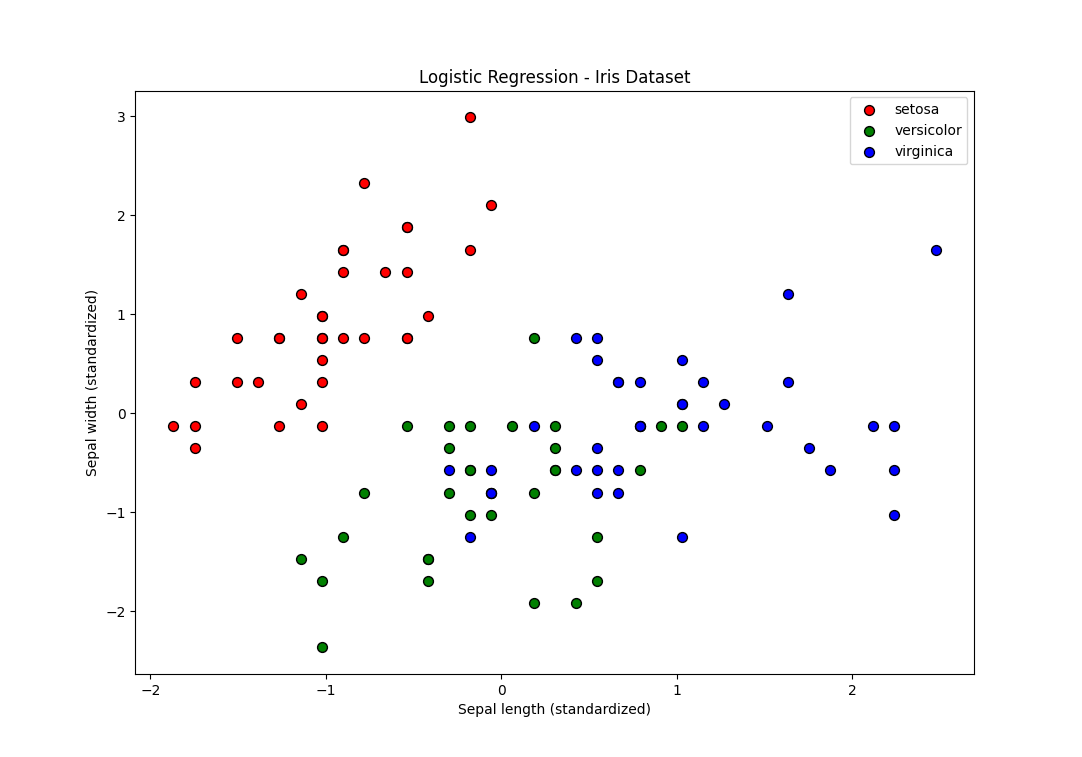
データに立ち戻ってみるとこの散布図だけはVersicolorとVirginicaが真ん中で混ざり合っています。これではどんなモデルでも(複雑度をめちゃめちゃ高くすれば話は別だが、そんなモデルを誰が求めるのだろうか…)うまく分類することはできないでしょう。
つまり、ガクの幅と長さに関しては、この2品種はかなり近い特徴を持っていて、Sepal lengthとSepal widthはこの2品種を分類するための特徴量として適切ではないと理解できます。
しかし「Serosaとそれ以外」という1対その他アプローチの考え方で言えばこの特徴量はうまく機能しているのでしょう。
■線形サポートベクターマシン
もう一つよく用いられている線形モデルを試してみます。
こちらもデータポイントを2つのクラスをに分ける超平面を見つけるのですが、クラス0とクラス1の最も近い点(サポートベクター)とのマージンが最大になるように最適化するのが特徴です。
$$ \min \frac{1}{2} ||\boldsymbol{ w }||^2 + C \displaystyle \sum_{i=1}^n \xi_i $$
$$ y_i (\boldsymbol{ w } \cdot x_i + b) \geq 1 $$
超平面を境界にすべてのデータポイントが1以上マージンがあり、w(法線ベクトル)を最小化(データポイントから離す)します。この通りに分類できないデータポイントに対してはペナルティを与えて誤分類を許容(モデルの複雑度を調整)します。これはソフトマージンと呼ばれ、Cで調節が可能です。
import numpy as np
import matplotlib.pyplot as plt
from sklearn import datasets
from sklearn.svm import SVC
from sklearn.preprocessing import StandardScaler
from sklearn.model_selection import train_test_split
from matplotlib.colors import ListedColormap

iris = datasets.load_iris()
X = iris.data[:, [1, 3]]
y = iris.target

X_train, X_test, y_train, y_test = train_test_split(X, y, test_size=0.3, random_state=8)

scaler = StandardScaler()
X_train_scaled = scaler.fit_transform(X_train)
X_test_scaled = scaler.transform(X_test)

model = SVC(kernel='linear')
model.fit(X_train_scaled, y_train)

print("train score: {}".format(model.score(X_train_scaled, y_train)))
print("test score: {}".format(model.score(X_test_scaled, y_test)))

x_min, x_max = X_train_scaled[:, 0].min() - 0.5, X_train_scaled[:, 0].max() + 0.5
y_min, y_max = X_train_scaled[:, 1].min() - 0.5, X_train_scaled[:, 1].max() + 0.5
xx, yy = np.meshgrid(np.arange(x_min, x_max, 0.02),
                     np.arange(y_min, y_max, 0.02))

Z = model.predict(np.c_[xx.ravel(), yy.ravel()])
Z = Z.reshape(xx.shape)

custom_cmap = ListedColormap(['lightcoral', 'lightgreen', 'lightblue'])

plt.contourf(xx, yy, Z, alpha=0.6, cmap=custom_cmap)

for i, color in zip([0, 1, 2], ['red', 'green', 'blue']):
    idx = np.where(y_train == i)
    plt.scatter(X_train_scaled[idx, 0], X_train_scaled[idx, 1], c=color, label=iris.target_names[i], edgecolor='k', s=50)

plt.xlabel('Sepal width (standardized)')
plt.ylabel('Petal width (standardized)')
plt.title('Linear SVM - Iris Dataset')
plt.legend()
plt.show()
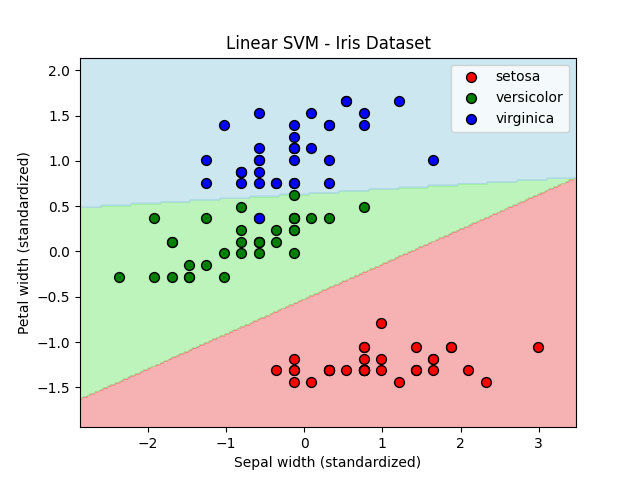
train score: 0.9904761904761905
test score: 0.8888888888888888
Sepal widthとPetal widthを特徴量に選んでモデルを作ってみました。C値はデフォルトで1.0です。(先ほどの結果からSepal lengthとSepal widthでは精度向上が期待できなさそうだったからです。)
ちなみにロジスティック回帰の結果は下記の通りです。
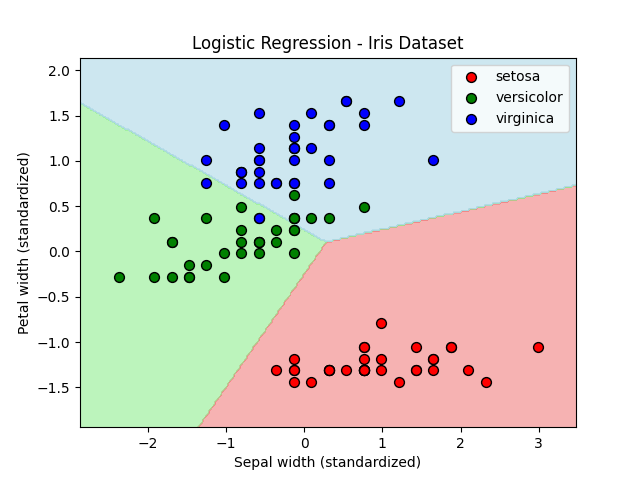
train score: 0.9142857142857143
test score: 0.8
過剰適合かどうかは置いておいて、線形サポートベクターマシンはVersicolorとVirginicaの境界を綺麗に分離できています。結果的にトレーニングスコアも過剰ですが、テストスコアもかなり高いです。
線形サポートベクターマシンの誤分類を制御するパラメータはC値だという話がありましたが、C値を変えていくとどうなるのでしょうか。C=0.001から100まで振ってみました。
import numpy as np
import matplotlib.pyplot as plt
from sklearn import datasets
from sklearn.svm import SVC
from sklearn.model_selection import train_test_split
from sklearn.preprocessing import StandardScaler

iris = datasets.load_iris()
X = iris.data[:, :2]
y = iris.target

X_train, X_test, y_train, y_test = train_test_split(X, y, test_size=0.3, random_state=8)

scaler = StandardScaler()
X_train_scaled = scaler.fit_transform(X_train)
X_test_scaled = scaler.transform(X_test)

C_values = [0.001, 0.01, 0.1, 1, 10, 100]
train_scores = []
test_scores = []

for C in C_values:
    model = SVC(C=C, kernel='linear')
    model.fit(X_train_scaled, y_train)
    train_scores.append(model.score(X_train_scaled, y_train))
    test_scores.append(model.score(X_test_scaled, y_test))

plt.figure(figsize=(10, 6))
plt.plot(C_values, train_scores, label='Training Score', marker='o')
plt.plot(C_values, test_scores, label='Test Score', marker='o')
plt.xscale('log')
plt.xlabel('C Value (log scale)')
plt.ylabel('Score')
plt.title('Score for Various C Values')
plt.legend()
plt.grid()
plt.show()
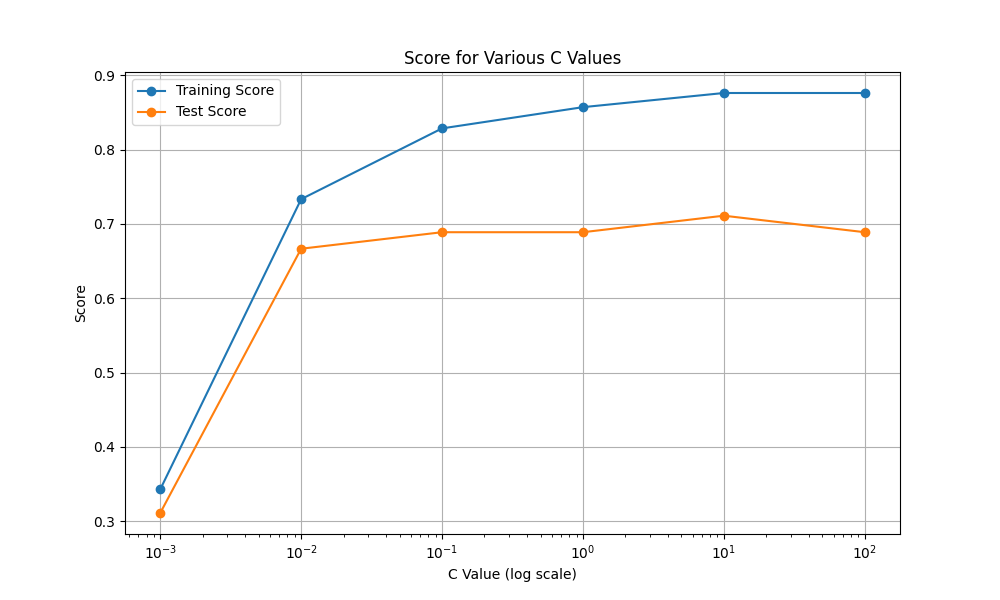
C=0.001ではかなりの誤分類を許容してしまって精度が著しく下がっているように見えます。C=10以降は過剰適合になっていきそうです。
■ナイーブベイズクラス分類器
最後にナイーブベイズクラス分類器(単純ベイズ分類器)を試してみたいと思います。
ナイーブベイズクラス分類器は先ほどのロジスティック回帰や線形サポートベクターマシンよりも高速(後者2つも十分に高速だが)で、特徴量ごとにクラスの統計値を集めて確率論的にシンプルで効率的に学習するのが特徴です。特徴量に相関があるかに寄らず、互いに独立していると仮定することで単純な入力に落とし込みます。ただし速度と引き換えに汎化性能は劣ります。
import numpy as np
import matplotlib.pyplot as plt
from sklearn import datasets
from sklearn.naive_bayes import GaussianNB
from sklearn.preprocessing import StandardScaler
from sklearn.model_selection import train_test_split
from matplotlib.colors import ListedColormap

iris = datasets.load_iris()
X = iris.data[:, [1, 3]]
y = iris.target

X_train, X_test, y_train, y_test = train_test_split(X, y, test_size=0.3, random_state=8)

scaler = StandardScaler()
X_train_scaled = scaler.fit_transform(X_train)
X_test_scaled = scaler.transform(X_test)

model = GaussianNB()
model.fit(X_train_scaled, y_train)

print("train score: {}".format(model.score(X_train_scaled, y_train)))
print("test score: {}".format(model.score(X_test_scaled, y_test)))

x_min, x_max = X_train_scaled[:, 0].min() - 0.5, X_train_scaled[:, 0].max() + 0.5
y_min, y_max = X_train_scaled[:, 1].min() - 0.5, X_train_scaled[:, 1].max() + 0.5
xx, yy = np.meshgrid(np.arange(x_min, x_max, 0.02),
                     np.arange(y_min, y_max, 0.02))

Z = model.predict(np.c_[xx.ravel(), yy.ravel()])
Z = Z.reshape(xx.shape)

custom_cmap = ListedColormap(['lightcoral', 'lightgreen', 'lightblue'])

plt.contourf(xx, yy, Z, alpha=0.6, cmap=custom_cmap)

for i, color in zip([0, 1, 2], ['red', 'green', 'blue']):
    idx = np.where(y_train == i)
    plt.scatter(X_train_scaled[idx, 0], X_train_scaled[idx, 1], c=color, label=iris.target_names[i], edgecolor='k', s=50)

plt.xlabel('Sepal width (standardized)')
plt.ylabel('Petal width (standardized)')
plt.title('Naive Bayes Classifier - Iris Dataset')
plt.legend()
plt.show()
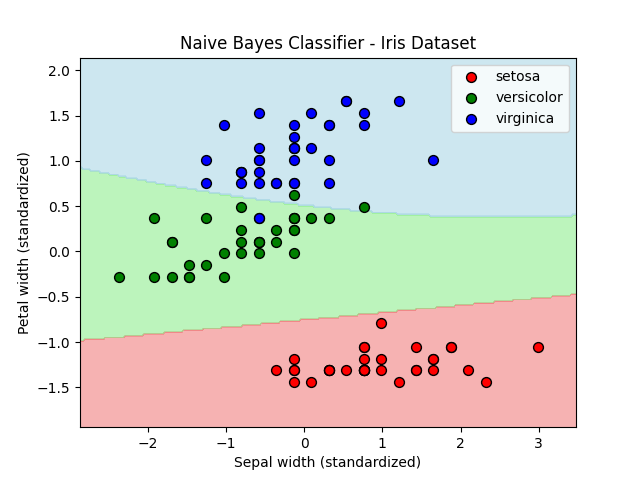
train score: 0.9714285714285714
test score: 0.8666666666666667
先ほどから用いているあやめデータセットに対してナイーブベイズクラス分類器からガウシアンナイーブベイズを適用してみました。
あれ、結構いいスコアです。
スピード感としては元々割とハイスペックなPC(Ryzen9 7900X3D, RAM32GB, SSD4TB, HDD8TB, GeForce RTX 4070 Ti SUPER)を使っているのと、適用するデータ量がかなり少ないので、ロジスティック回帰や線形サポートベクターマシンでも遅いとは思わなかったですが、ガウシアンナイーブベイズはかなり速かったです。所感でいうと同じネット環境での安めのAndroid端末と最新のiPhoneくらいの差でぬるぬるでした。
■おわりに
精度を上げるために(できればトレーニングスコアを超えたかった)試行錯誤をしましたが、調整パラメータがそれほどないためクラス分類に関しても前処理の重要性を痛感しました。
ちょっと通読の順番を変えたいかもしれない…笑
■参考文献
- Andreas C. Muller, Sarah Guido. Pythonではじめる機械学習. 中田 秀基 訳. オライリー・ジャパン. 2017. 392p.
- ChatGPT. 4o mini. OpenAI. 2024. https://chatgpt.com/
- API Reference. scikit-learn.org. https://scikit-learn.org/stable/api/index.html